Smali is an assembler for the Dalvik Virtual Machine bytecode. Furthermore, code produced by the baksmali often considered to be written in the Smali language. Of course if there is an assembler, there should be a disassembler and there is no exception in this case. Baksmali is an disassembler for the dex bytecode format. The words “Smali” and “Baksmali” are just the Icelandic equivalents of “assembler” and “disassembler” respectively. Before now debugging smali code was not an easy task, but recently a great plugin for Intellij IDEA/Android Studio has been published – Smalidea. It makes the Smali debugging much more easier.
Introduction
This tutorial covers some advanced topics, therefore appropriate skills are required. The most important question you need to have answer to: “Why do you need to debug Smali code ?”. But anyway I will try to keep things as simple as possible.
Prerequisites
In order to follow all steps in this tutorial you need to have the following software packages installed:
- Android Studio and Intellij IDEA 14.1 or above
- Java Runtime Environment (JRE)
- Java Development Kit (JDK)
- The latest APK Tool (Jar file)
Step 1 — Installing the Smalidea plugin
To start with, download the latest plugin package from this page. At the time of writing this post it is the archive smalidea-0.05.zip.
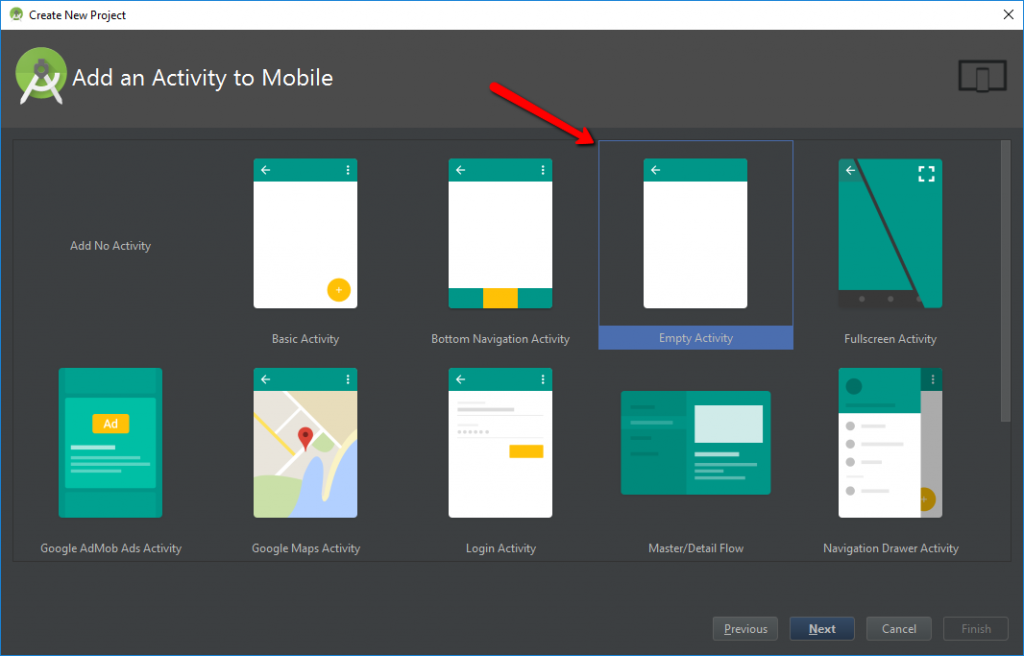
Before we start, I suggest you to create a new project in Android Studio for this tutorial. I will create a project from the Empty Activity template. You are free to use any project you want.
You can either use Android Studio or Intellij IDEA, I have tested both of them, but for this tutorial I will use Intellij IDEA. And in the fifth step I will show briefly how to use Android Studio.
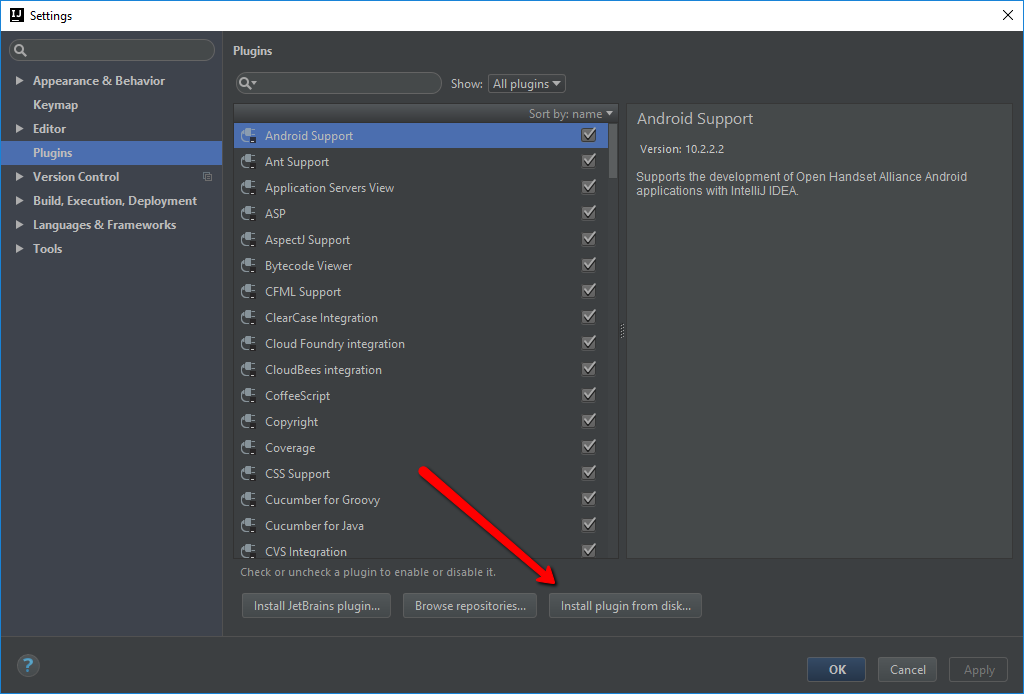
Now, go to the settings by clicking File > Settings or using the shortcut ⌘ + , or Ctrl + Alt + S. Then, open the Plugins section and click on the “Install plugin from disk button”.
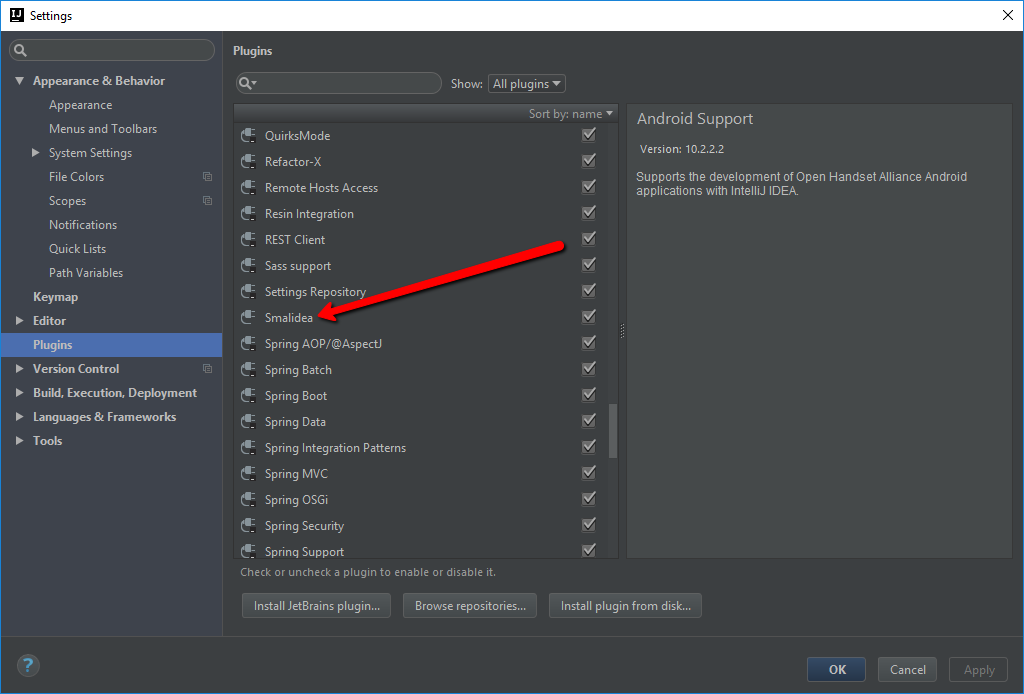
Select the downloaded file. After that you should see the Smalidea plugin in the list.
Now, restart Intellij IDEA.
Step 2 — Decompiling an APK file
First of all, in order to decompile an apk file, you need to have it :). So compile at least once the created project. After that you should be able to find compiled apk file in the folder YourProjectPath/app/build/outputs/apk/.
Follow the steps described in this Installation Guide to install and use APKTool.
Next, copy the compiled apk file to a directory, that is going to be used as the root directory for a new project.
Now is the time to decompile the apk file. To do this use the APKTool command.
1 | apktool d app-debug.apk
|
You should get the similar output:
1 2 3 4 5 6 7 8 9 10 11 12 | H:/Development/Mobile/Android/Tutorials/Smalidea>apktool d app-debug.apk -o src-smali
I: Using Apktool 2.2.2 on app-debug.apk
I: Loading resource table...
I: Decoding AndroidManifest.xml with resources...
I: Loading resource table from file: C:/Users/CROSP/AppData/Local/apktool/framework1.apk
I: Regular manifest package...
I: Decoding file-resources...
I: Decoding values */* XMLs...
I: Baksmaling classes.dex...
I: Copying assets and libs...
I: Copying unknown files...
I: Copying original files...
|
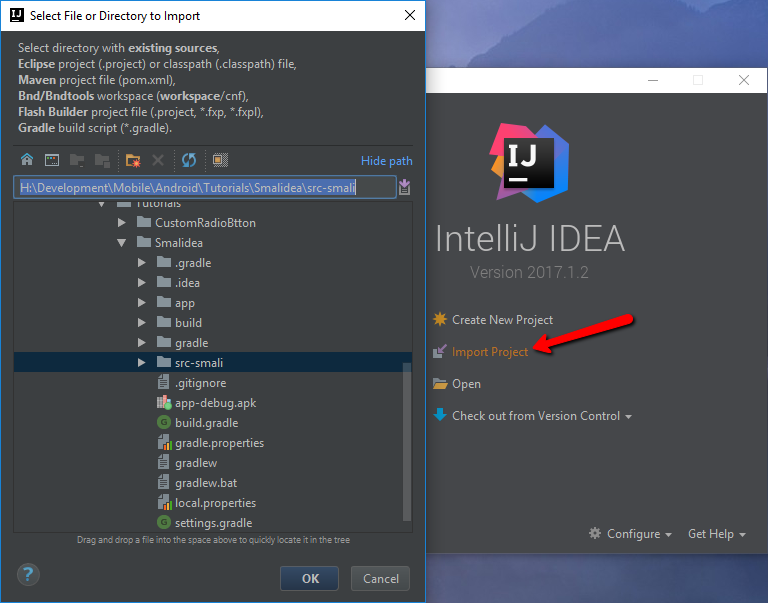
Next, open Intellij IDEA and click on the Import Project option or in case you have an opened project, use File > New > Project From Existing Sources. Select the folder where you have decompiled the APK file to.
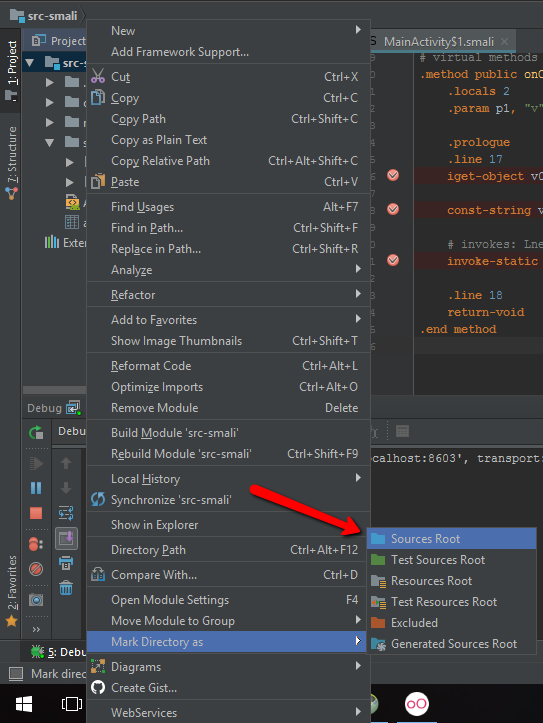
After you have the project opened, right click on the root folder, then select Mark Directory As and Source Root.
Step 3 — Configuring Debugger
In order to start debugging smali code you have to setup remote debugger to your application.
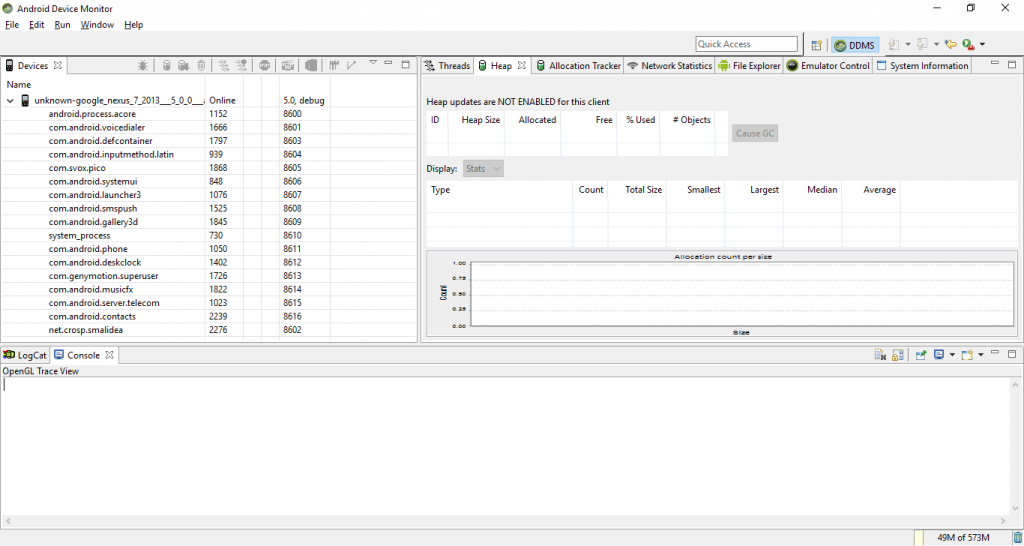
First of all, start Android Dalvik Debug Monitor Server (DDMS). You can start it from Android Studio by selecting Tools > Android > Android Device Monitor or directly from the SDK directory, in my case it is C:/Users/CROSP/AppData/Local/Android/sdk/tools and the .bat file name is monitor.bat.
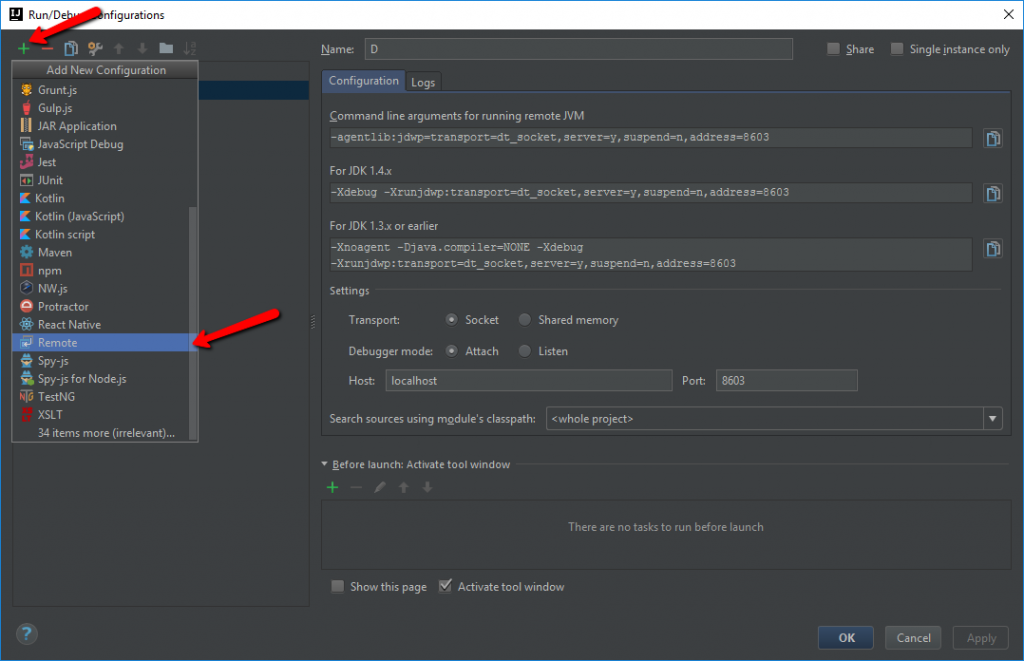
The next step is to create Remote Debug Configuration. To do this click Run > Edit Configuration, then click on the plus sign and select Remote from the dropdown list.
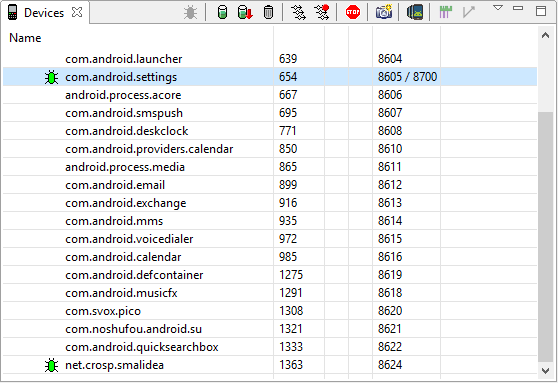
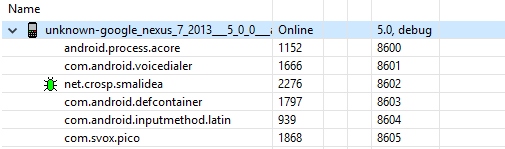
Now switch to DDMS. I also assume that you have a running device or emulator. Start your application on a device. It should be in the list of device running process.
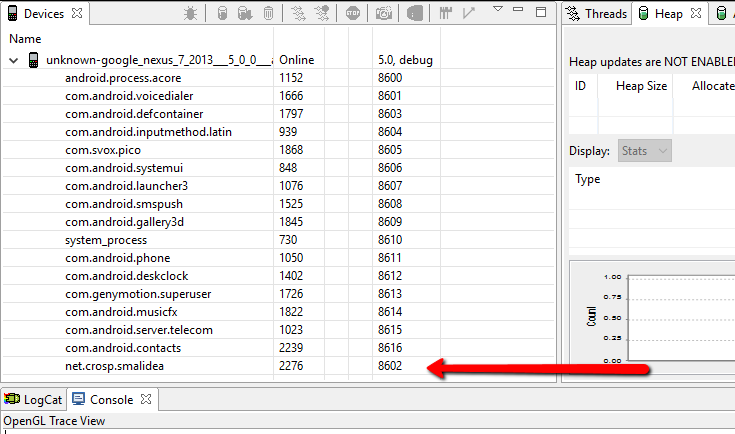
In the last column you can find the debug port number for each process. In my case the port number is 8602.
Switch back to Intellij IDEA and enter the port number of your running process in the Debug Configuration window.
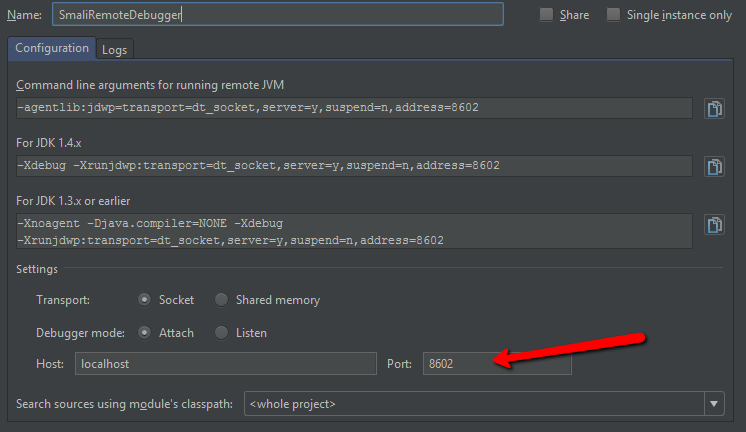
Save the configuration.
Step 4 — Port number 8700
In the previous step I have used the concrete port that is uniquely assigned for each running application. But a port number is not a constant value and can be changed even for the same application.
DDMS provides the ability to use the same port number 8700 to dynamically assign it to a desired application.
Let’s modify the debug configuration, changing the port number to 8700.
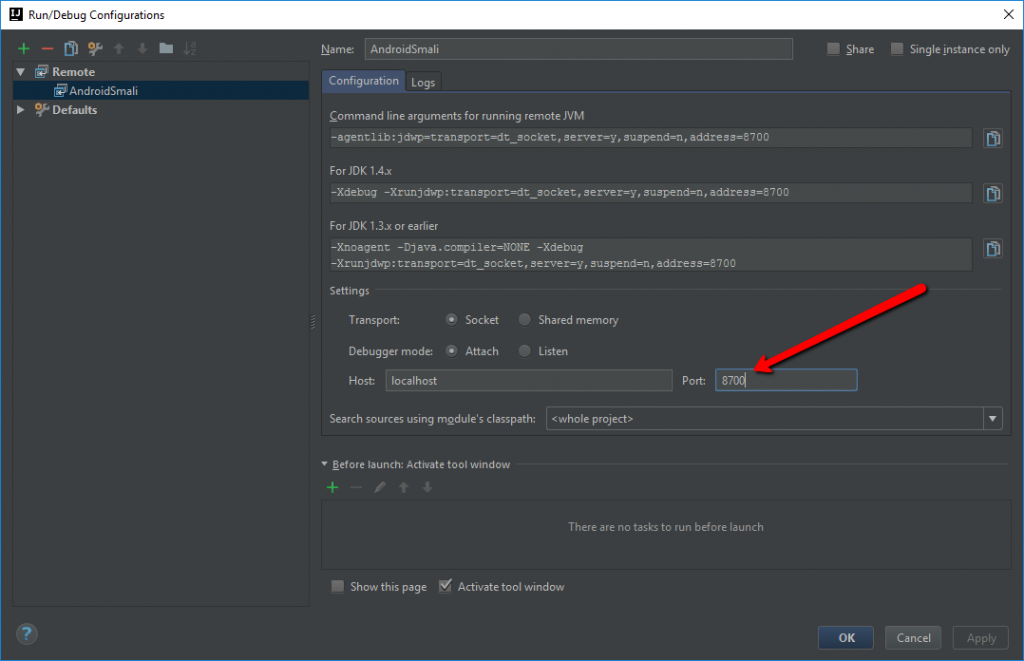
Save the configuration and switch back to DDMS.
Now select an application you want to debug from the list. You should see the port number 8700 just appeared after the default application port separated by the slash ( / ).
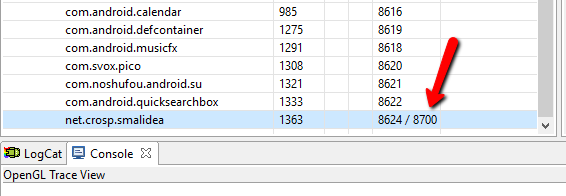
As a result you don’t have to change a port number each time it is changed by the system. But on the other hand if you need to debug multiple applications simultaneously you are need to use concrete port numbers.
Go to the next step.
Step 5 — Debugging Smali code
You should have everything set up for now to start debugging smali code.
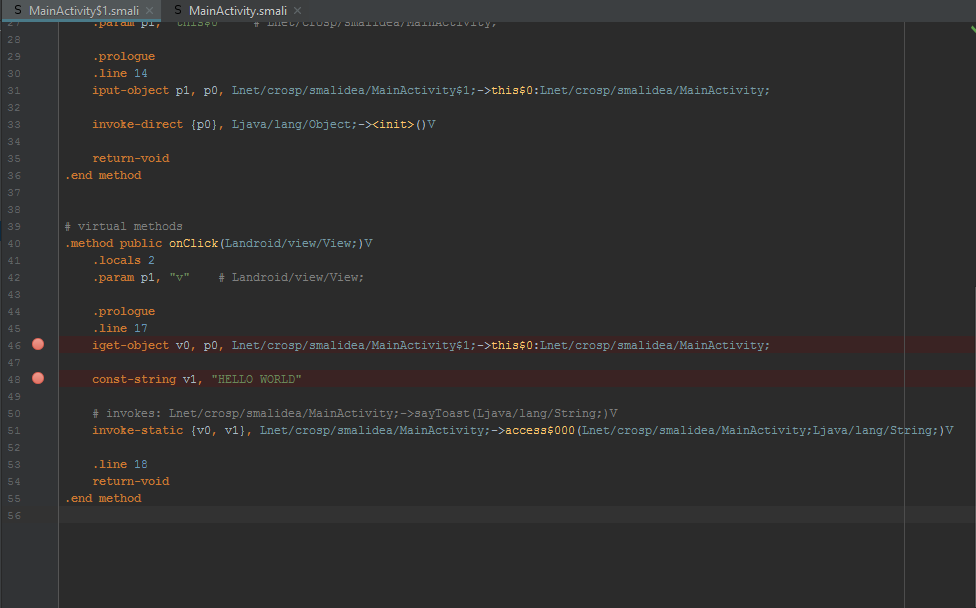
Set brakepoints where you need, but of course they should reachable, for instance, a function call triggered by clicking on a button. I have implemented the button click listener, that shows the toast message.
1 2 3 4 5 6 7 8 9 10 11 12 13 14 | @Override
protected void onCreate(Bundle savedInstanceState) {
super.onCreate(savedInstanceState);
setContentView(R.layout.activity_main);
findViewById(R.id.button_say_somthing).setOnClickListener(new View.OnClickListener() {
@Override
public void onClick(View v) {
sayToast("HELLO WORLD");
}
});
}
private void sayToast(String message) {
Toast.makeText(this,message,Toast.LENGTH_LONG).show();
}
|
Here are the breakpoints I’ve set.
Finally, ensure that your app is still running and visible in the DDMS, in case of using the port number 8700 for debugging check that the right application is selected. Run Debug in your IDE.
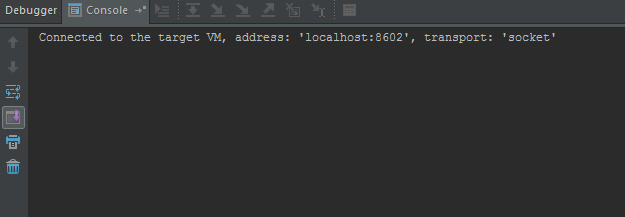
You should see a similar message in the console.
And in DDMS a little green bug should appear near your process name.
Eventually, trigger an event to reach your breakpoints.
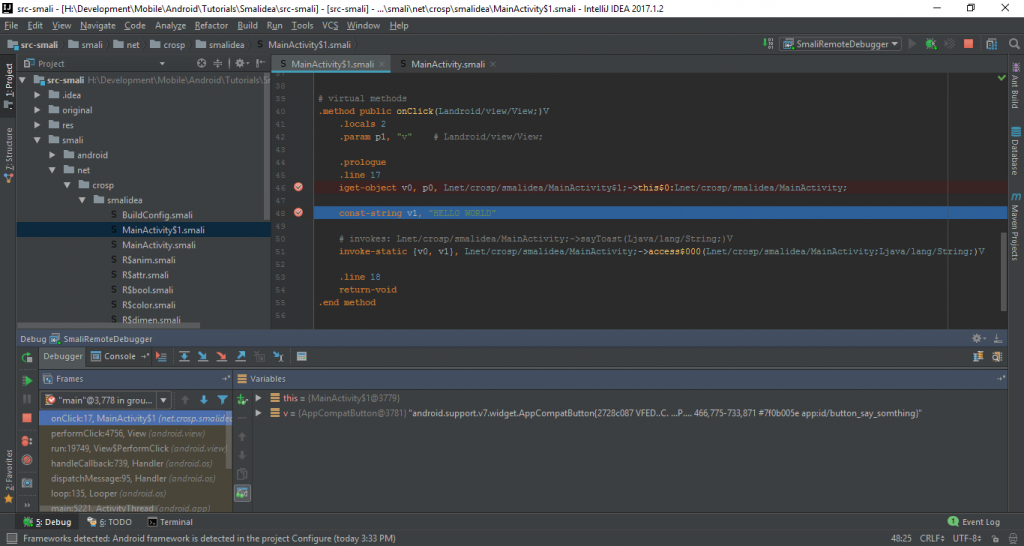
Congratulations, now you are able to debug the decompiled app step by step in the traditional way.
Step 6 — Debugging Smali in Android Studio
If you want to use Android Studio instead, follow the similar steps. But you probably won’t find the option Mark Folder As, but it works just fine without this step. Furthermore, it could be much more convenient to use Android Studio to keep both smali and java code in the same directory.
- Just copy the directory with decompiled source code to the Android project root directory (or any other directory in a project).
- In order to see this folder switch to the Project view
- Run > Edit Configurations
- Create a debug configuration in the same way as described in the Step 3
- Set breakpoints and run debugging
Bonus — Rebuilding decompiled app
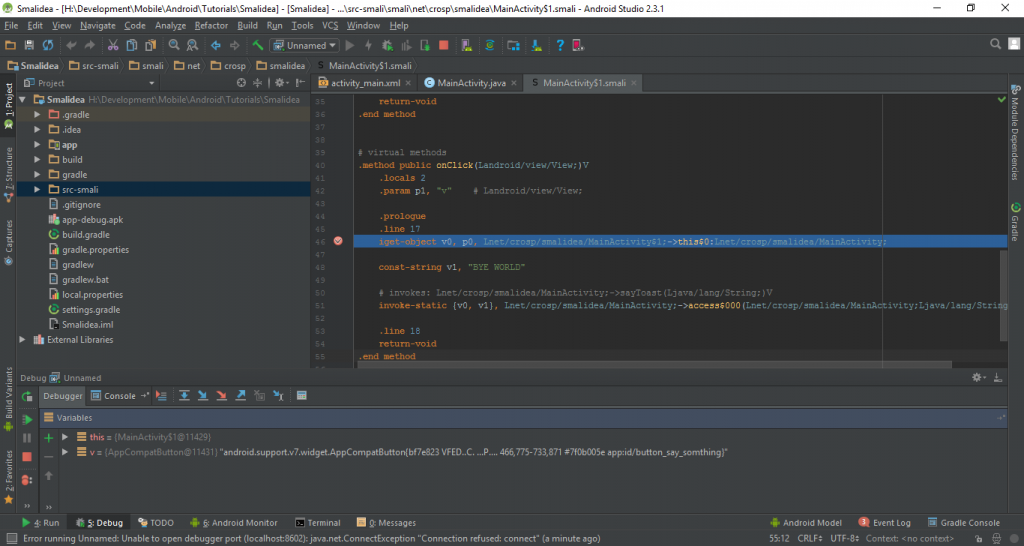
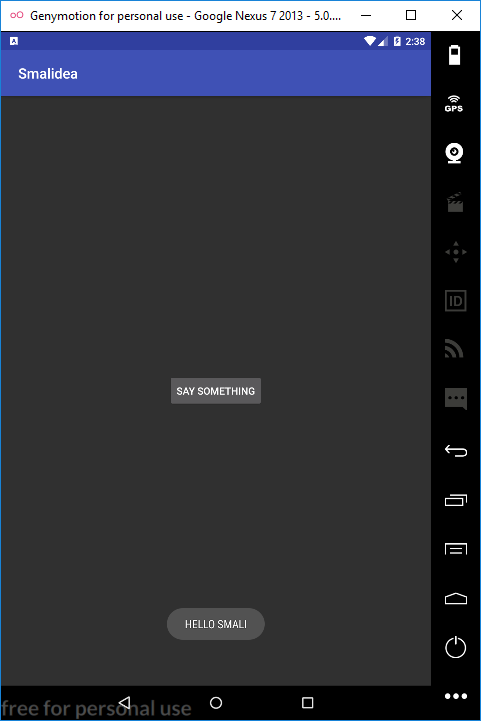
The last thing I want to cover in this tutorial is how to build a modified decompiled application. But let’s modify something at first. I will change the toast message from “HELLO WORLD” to “HELLO SMALI” as follows.
1 2 3 4 5 6 7 8 9 10 11 12 13 14 15 16 17 | # virtual methods
.method public onClick(Landroid/view/View;)V
.locals 2
.param p1, "v" # Landroid/view/View;
.prologue
.line 17
iget-object v0, p0, Lnet/crosp/smalidea/MainActivity$1;->this$0:Lnet/crosp/smalidea/MainActivity;
const-string v1, "HELLO SMALI"
# invokes: Lnet/crosp/smalidea/MainActivity;->sayToast(Ljava/lang/String;)V
invoke-static {v0, v1}, Lnet/crosp/smalidea/MainActivity;->access$000(Lnet/crosp/smalidea/MainActivity;Ljava/lang/String;)V
.line 18
return-void
.end method
|
With APKTool the build process is really simple.
1 | apktool b src-smali
|
But you will not be able to install just compiled apk file, as it is unsigned.
If you have a Google Developer Account, you are probably aware of the signing process. But I will show how to do this manually with self-signed key.
First and foremost, we need a tool called keytool in order to generate keys. To use it add the path_to_jdk/bin/ folder to system Path variable or just open Command Prompt in this directory.
Generate a keystore file
1 | keytool -genkey -v -keystore my-release-key.keystore -alias alias_name -keyalg RSA -keysize 2048 -validity 10000
|
And finally sign the apk file.
1 | jarsigner -verbose -sigalg SHA1withRSA -digestalg SHA1 -keystore my-release-key.keystore app-debug.apk alias_name
|
Finally, install the just signed apk file. And check the result.
Conclusion
In this tutorial I’ve described simple steps to install the Smalidea plugin, that makes the Smali Debugging process much easier. This plugin is available in “alpha” version, but according to the Github page, it is in active development. If you have any troubles, please feel free to leave comments below.
Hi, my name is Molochko Alexander, I am Interested in different areas of software development, curious about learning and discussing architectural and software patterns, examining internals and understanding how everything works under the hood.
Recent posts
- Mar 1, 2020 Implementing Laravel custom Auth Guard and Provider
- Feb 16, 2019 Hacking Java Applications with Byte Buddy and Decompilers
- Jan 5, 2019 Page Specific Dynamic Angular Components using Child Routes
- Oct 13, 2018 Understanding Dagger 2 Scopes Under The Hood
- Jul 21, 2018 Understanding and using Xdebug with PHPStorm and Magento remotely
Popular posts
- 143492 Views How to Install The Latest Apache Server (httpd) on Centos 7
- 106842 Views Routing network traffic through a transparent SOCKS5 proxy using DD-WRT
- 76565 Views How to Unbrick TP-Link WiFi Router WR841ND using TFTP and Wireshark
- 75294 Views Android Reverse Engineering: Debugging Smali in Smalidea
- 62747 Views Clean Architecture : Part 2 – The Clean Architecture