Xdebug is a great way to eliminate var_dump(), print_r() statements and make your PHP debugging experience better and more productive. When you have a simple application there is not really need to spend time on configuring Xdebug, you can go along with dumping varialbes, however in such applications and frameworks like Magento it is really hard to debug using var_dump statements. This is caused by a huge code base of the Magento platform as a result use of caching everywhere where it is possible or not. Furthermore, tracing a path of a function call can be a really tedious task. Using Xdebug together with PHPStorm makes debugging much easier.
Introduction
There are lot of articles out there, however I remember the time when I have tried several times to configure Xdebug, unfortunately all attempts failed because of the lack of understanding how all these tools work under the hood.
The main intention of this article is to explain how does XDebug work and what problems I’ve encountered while configuring it for my projects. Personally, I always try to understand how something works under the hood and I think that worth it in any case.
I won’t cover all benefits and features of XDebug, there is enough information already provided. One important reason to start using XDebug is debugging in production. In case of using var_dump(), print_r() statements you are not only providing visitors a ton of scary information, but you are also risking to have your sensitive data be exposed. For instance database credentials.
Understanding Xdebug
First of all we need to understand how does the XDebug debugger work. Xdebug is a PHP extension, that is loaded dynamically as a shared library (.so), therefore before using it you need to compile it. We will see later how to compile and install this extension.
XDebug differs from other debugging tools you may be familiar with. XDebug works over the protocol that requires your local machine to listen for incoming connections from a server where an application you are debugging is located. You may already have used debugging tools that simply connect to a remote server or a process of your application. But in case of XDebug it works other way round, it is similar to the concept of “callback” in programming languages. Lets explore this communication step by step.
XDebug connection flow
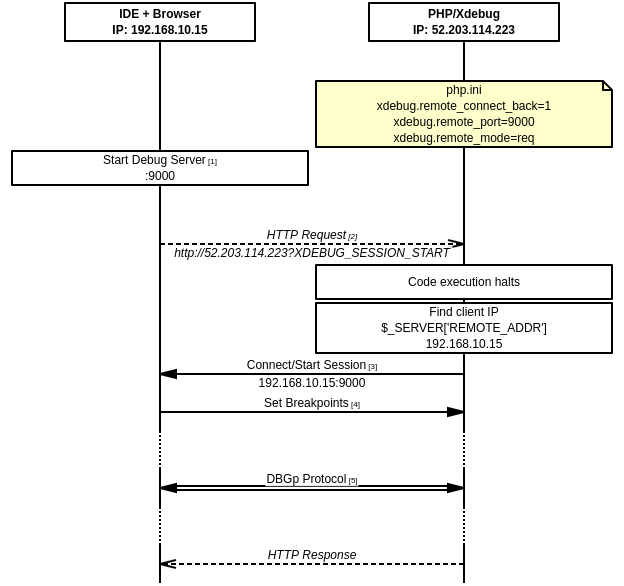
There is a nice illustration that will help to understand the flow better.
- Start a debugging server on the local machine. Usually port 9000 is used to listen for incoming connections
- Send the HTTP request (with some arguments and parameters) to activate XDebug on the server side
- Depending on the configuration, XDebug on the server side will try to connect to your machine to start debugging session. Commonly the host is set to localhost:9000 or the IP address from which the request was made
- A debugging session started and works further over the DBGP protocol
To sum up and get better understanding here is one more useful illustration for the flow.
If you are curious, as I am, about these steps, how everything works under the hood, let’s explore them deeply but without concrete configuration for now, I will show a real configuration a bit latter.
XDebug client/server/listener
As I have already mentioned, XDebug works in the way that the part that wants to debug application should listen to incoming connections.
Let’s follow the naming convention and call the guy that listens for back connections from a remote server – XDebug Client. Generally this may be called a server, as far as it is listening for connections from a remote server.
Consequently, on your local machine you need to start the XDebug client on your local machine in your code editor. I prefer using the PHPStorm IDE, but you are free to use any other editor, like Sublime Text 3, Brackets, etc. But at first ensure that your editor already has an XDebug plugin available.
Later, I will explain how to configure PHPStorm, but the final result should be the same, you have to have the XDebug client listening to a port, usually it is 9000. As a result you should be able to verify it for instance using the following command on Linux.
1 | netstat -tulpn | grep "9000"
|
Or in case you are a Mac user the following command can be useful.
1 | sudo lsof -i -n -P | grep "TCP.*:9000"
|
In my case I got the following output.
1 2 3 | Alexanders-MacBook-Pro:~ crosp$ sudo lsof -i -n -P | grep "TCP.*:9000"
Password:
phpstorm 45069 crosp 23u IPv4 0x9bc0aed7d39b0659 0t0 TCP *:9000 (LISTEN)
|
You may have a question regarding this matter. How to listen for incoming requests if you have a dynamic IP address or your network behind a firewall. The answer is to use SSH port forwarding, we will see later how to forward ports.
Activating the XDebug session
To start debugging, considering that a server needs to connect to our machine, we need to inform the server about our intent. This can be done in the several ways:
- Append the GET parameter or the POST variable – You can append the following parameter XDEBUG_SESSION_START=name to your website url, for instance http://example.com?XDEBUG_SESSION_START=PHPSTORM. In that case the server will issue a cookie that will be set in response.
- Set the cookie manually – You can set the XDEBUG_SESSION cookie manually to enable the debugging session. Of course setting cookies manually is a tedious task, so there are some plugins available for that purpose.
Here is how it looks like in the request headers. You can see that the XDEBUG_SESSION cookie is being sent with the request.
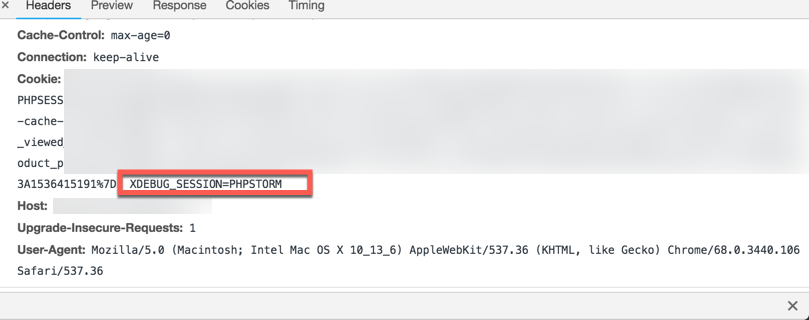
To disable debugging session you have to delete the cookie.
Setting up XDebug
As the title states, in that article I will show how to debug a Magento project, however you are free to use any kind of PHP project. Magento is the CMS that really requires debugging, because of enormous codebase and not trivial request handling.
Configuring XDebug server
I won’t show how to install the PHP interpreter and assume that you already have PHP up and running.
In my case I have the following configuration:
1 2 3 | Server OS - Linux Debian 9
HTTP Server - Nginx 1.14.0
PHP - PHP 7.0.27 FPM
|
As it was already mentioned, XDebug is a native extension for PHP and provided as a shared (.so) library. Hence, you need to compile and install this extension at first. The most easy and fast way I have found is to use PECL.
To install XDebug using PECL type the following command in the terminal.
1 | pecl install xdebug
|
After that you will see compilation process and when it is done you should see the path of the compiled extension. On my server I got the following output.
1 2 3 4 5 | Build process completed successfully
Installing '/usr/lib/php/20151012/xdebug.so'
install ok: channel://pecl.php.net/xdebug-2.6.1
configuration option "php_ini" is not set to php.ini location
You should add "zend_extension=/usr/lib/php/20151012/xdebug.so" to php.ini
|
Next, you need to enable the XDebug extension by modifying the php.ini configuration file. In my case I had to create a config file located at /etc/php/7.0/fpm/conf.d/20-xdebug.ini. But configuration options, of course, are the same.
The XDebug extension has a lot of configurable options, they are described in details on the official page. For my needs I used the following configuration.
1 2 3 4 5 6 7 8 9 10 | zend_extension=/usr/lib/php/20151012/xdebug.so
[Xdebug]
xdebug.remote_host=localhost
xdebug.remote_connect_back=0
xdebug.remote_enable=1
xdebug.remote_port=9900
xdebug.idekey="PHPSTORM"
xdebug.remote_log="/tmp/xdebug.log"
xdebug.remote_handler=dbgp
|
I have to explain some of the options above.
xdebug.remote_host – is set to localhost, as far as we will use port forwarding to our local machine further. You can set it to a specific domain or a IP address.
xdebug.remote_connect_back – is disabled by default. This option allows to dynamically connect to an IP address that requested start of the XDebug session. But this option won’t work in most cases, as far as mostly your machine will be behind firewalls, have a dynamic IP address and ports closed. Considering all these problems, the best option is to use port forwarding.
xdebug.remote_port – I have used not a default port number, in order to make it more explicit when we will configure port forwarding.
xdebug.idekey – The value of this option defines the key that should be pass while initializing the XDebug session as was previously discussed. In my case the value is PHPSTORM.
Other options are self-descriptive, and for additional information you can refer to the official page.
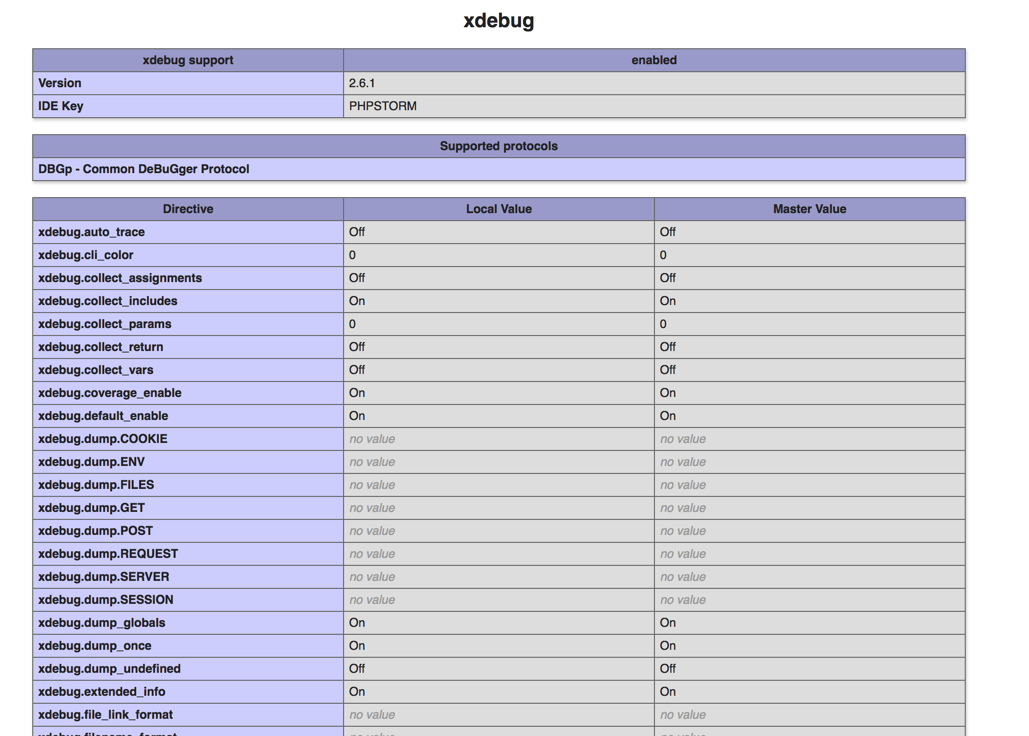
In on order to apply changes restart the PHP service, if you have the FPM type of course. Now verify that the XDebug extension has been successfully enable, for instance using a well-known function – phpinfo(). You should get a similar output.
Configuring XDebug client
Now it’s the time to configure our IDEA, PHPStorm in the context of this article. Before starting, please make sure that you have an exact copy of your files on your local development machine. This is required for a correct work of the debugger.
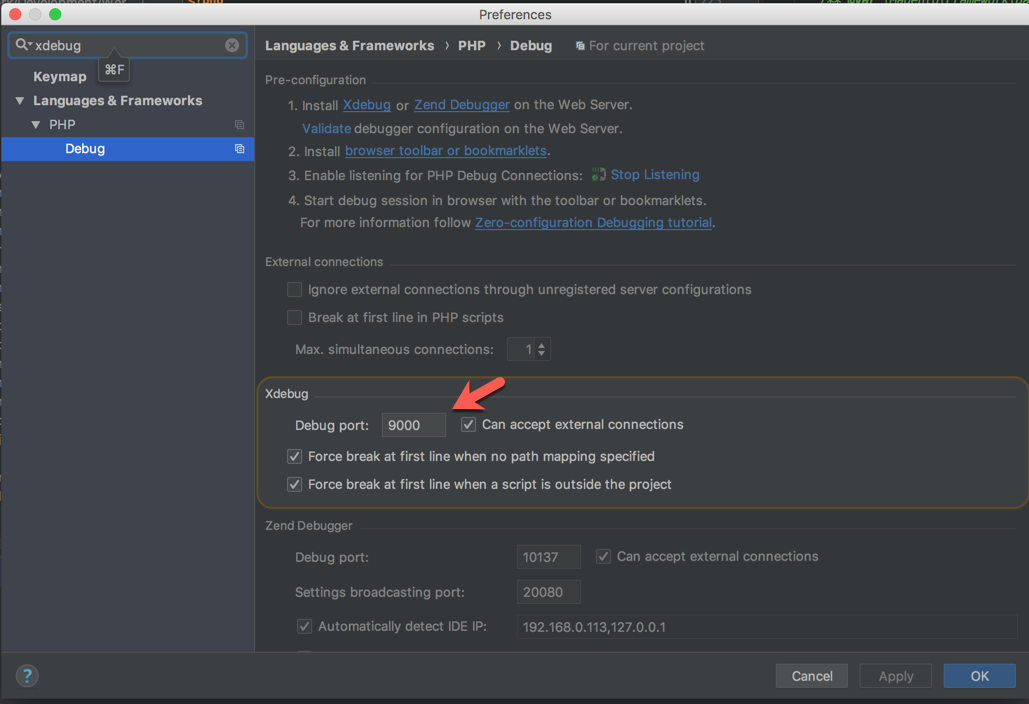
Open your project. Open settings in the IDEA and search for xdebug. Set the following options according your requirements. Please note, that even that we have set the port number to 9900 on our server, however we have 9000 on the local machine. You will see in a while why. But please check twice that there are no local process already using 9000 port. If you have PHP-FPM locally installed it will use this port, so you have to use another one.
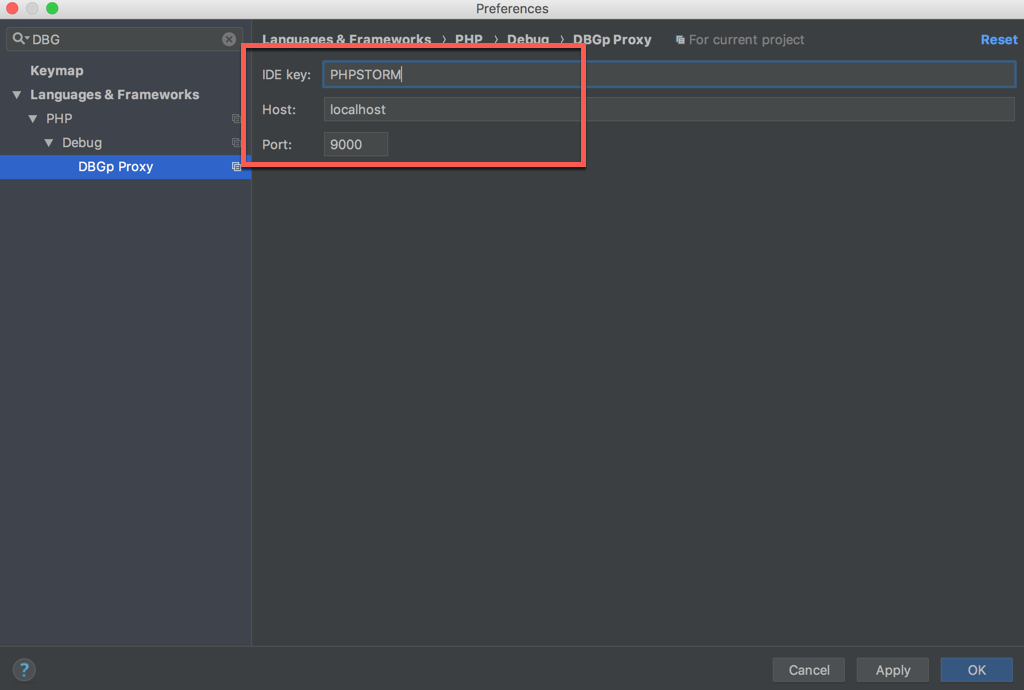
Now search for DBGp and set the settings according to the previous configuration. This configuration is required for multiuser debugging. If you are the only one person debugging the application, you may skip this step.
One more thing you can configure is to create a Remote Debug configuration. I have set it up as follows.
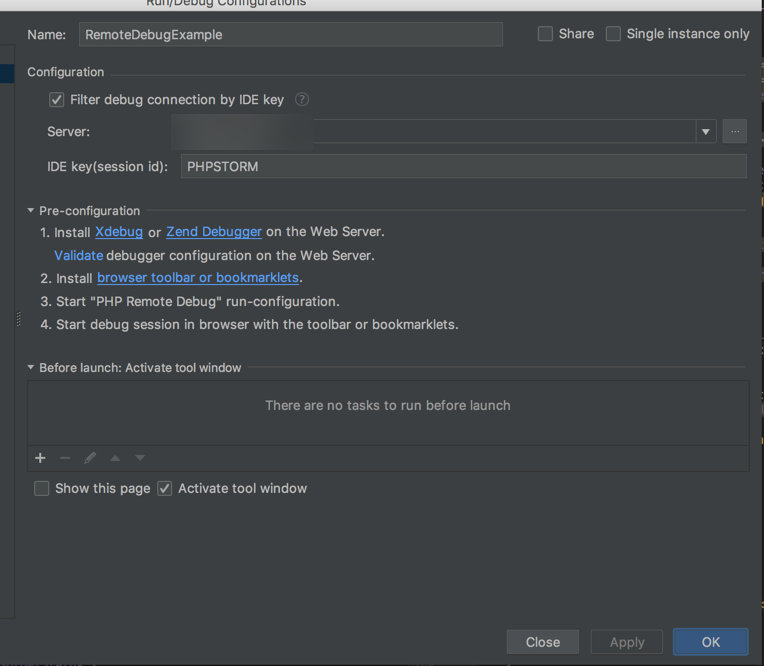
You can run this debug configuration to start listening for configured port, however personally I haven’t found any difference between this configuration and the regular configuration.
Start Debugging and port forwarding
Finally, we are up to start debugging, but before that we need to configure SSH Port Forwarding. I won’t explain this concept deeply, you can find a lot of articles about port forwarding.
However, for better understanding here is a picture how it works.
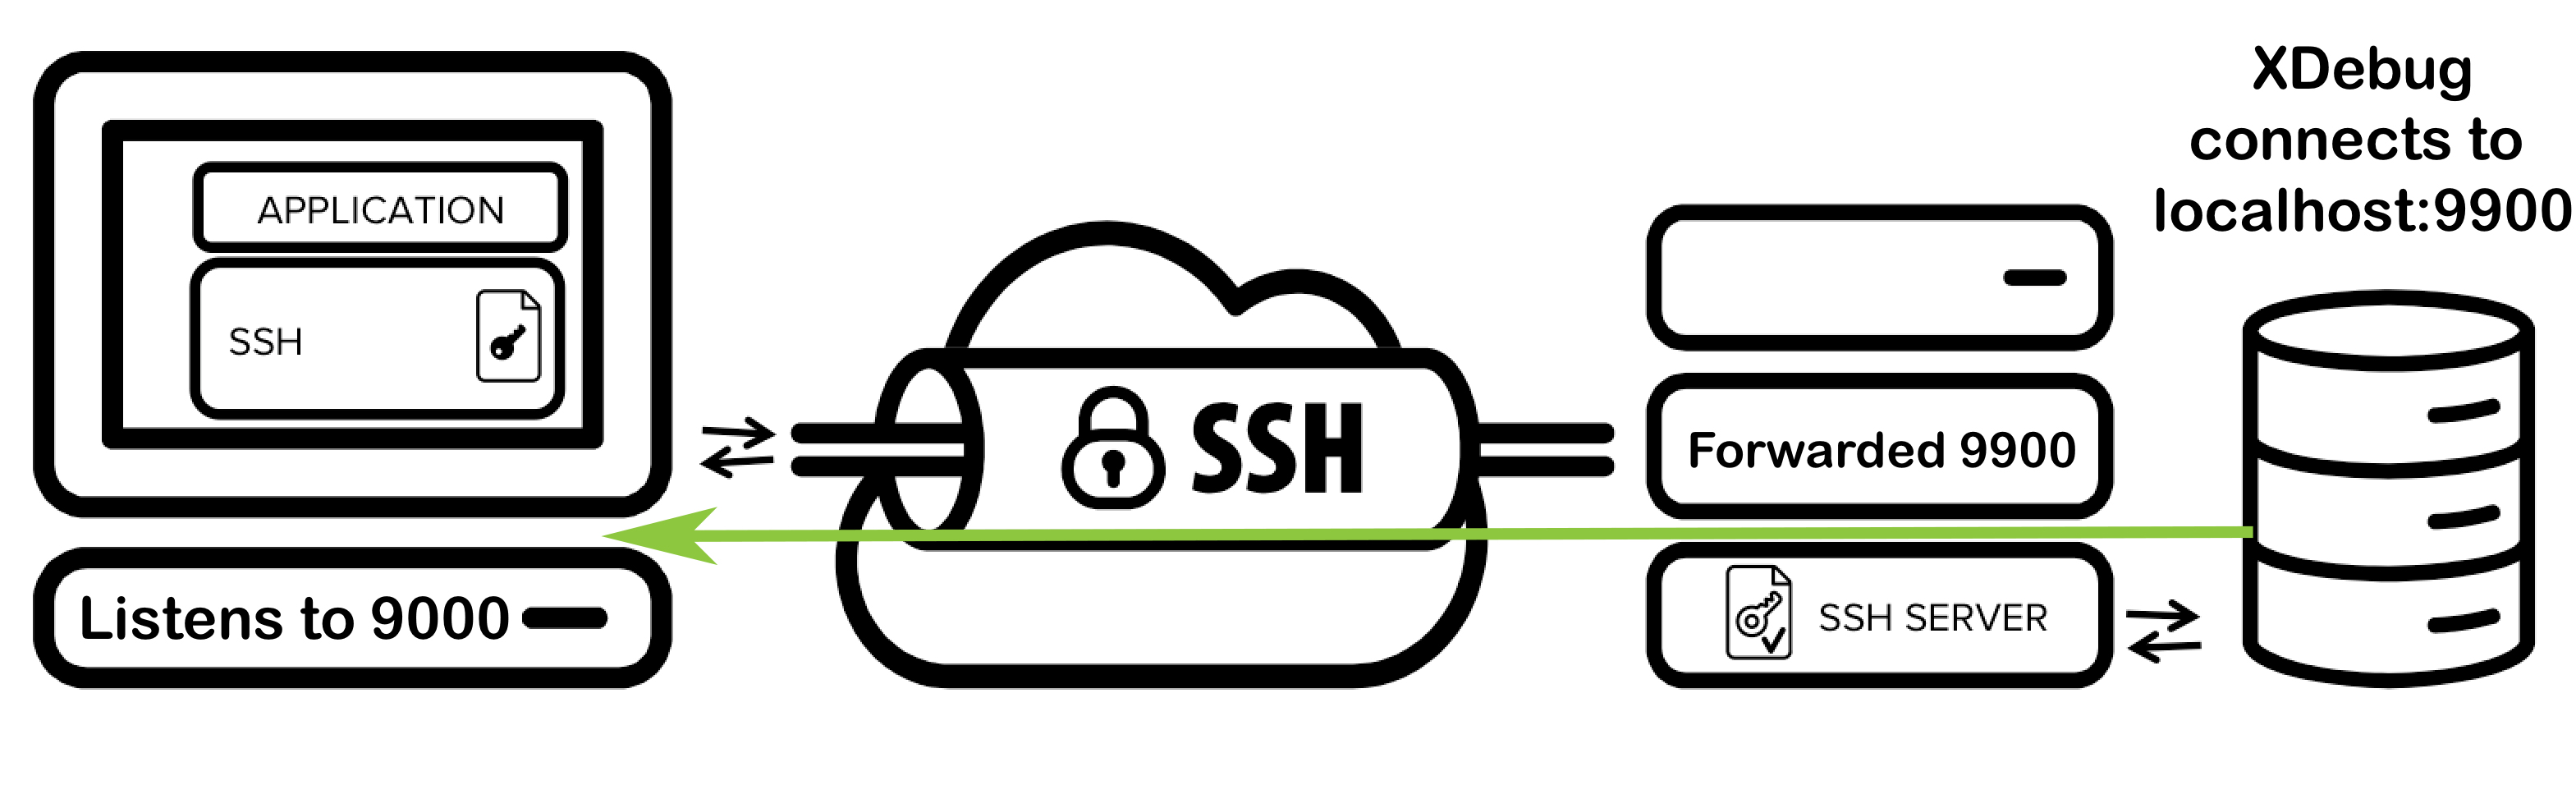
So basically you are redirecting all requests from you server that come to port 9900 to the local machine on port 9000 through the SSH Tunnel. To setup the forwarding you can use the following command.
1 | ssh -R 9900:localhost:9000 your_ip_hostname_or_config_alias
|
Ensure that you have no error messages, for instance if on your remote server the port is already used, the port forwarding fails. In my case I had the following message Warning: remote port forwarding failed for listen port 9900
As you can see, the remote port is set 9900, but our local port that PHPStorm debugger listens to is 9000. You can freely change any of these ports by changing the configuration explained above. Such type of communication is firewall sustainable and much more secure.
To init the XDebug session, as was mentioned earlier, you need to set the cookie. To do that there is a great extension for the Chrome browser – XDebug Helper. It do this work for you, also it is capable of tracing and profiling.
Implementation
There is no magic behind this extension, it just sets the cookie and unsets it when you stop debugging. You can have a look at source code of the extension.
1 2 3 4 5 6 7 | if (status == 1)
{
// Set debugging on
setCookie("XDEBUG_SESSION", idekey, 365);
deleteCookie("XDEBUG_PROFILE");
deleteCookie("XDEBUG_TRACE");
}
|
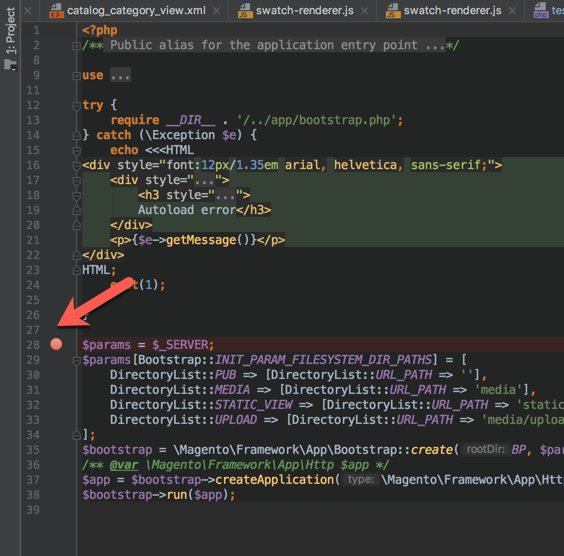
Now set breakpoints on the line you are interested in. For example I will a breakpoint in the pub/index.php file.
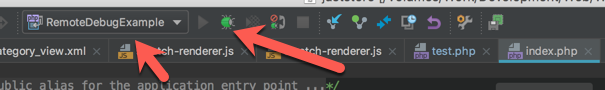
To start listening to incoming debug connections. You can do this in several ways. You can just click on this button in PHPStorm
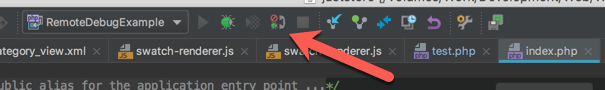
Or you can use the preconfigured remote debug configuration.
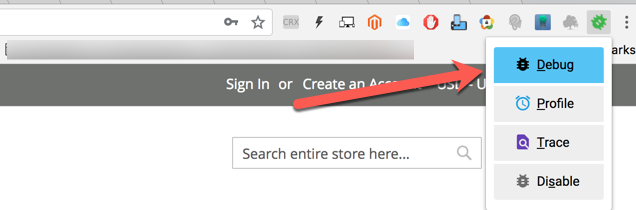
After all these steps enable the extension in your browser on the web page of your application, by clicking on the green bug icon.
Finally, refresh your page and after some time you should see a familiar debug window appeared in PHPStorm. Also you may be asked about accepting debug connections.
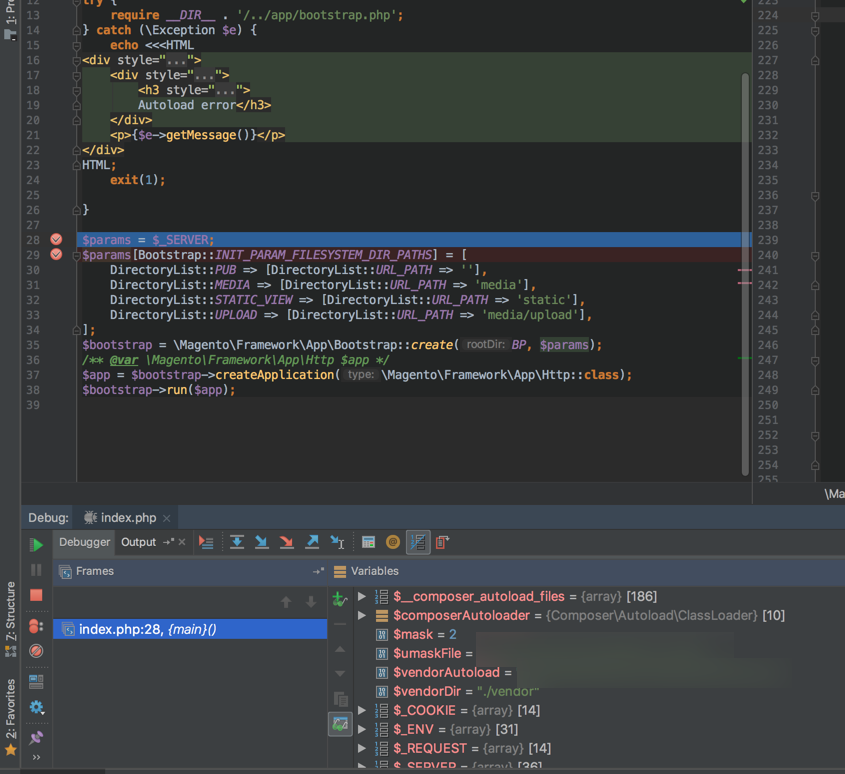
Now you are able to debug your application step by step without a single var_dump
Conclusion
In that article I tried to explain how does XDebug works, I think this is crucial for using it. Furthermore, it is always worth it to understand how things work under the hood.
The configuration described in that article is only one possible way, that works well in my case. If you have other situation, you may need another configuration. Anyway, if you have problems with configuring XDebug, please feel free to ask below in the comments.
Hi, my name is Molochko Alexander, I am Interested in different areas of software development, curious about learning and discussing architectural and software patterns, examining internals and understanding how everything works under the hood.
Recent posts
- Mar 1, 2020 Implementing Laravel custom Auth Guard and Provider
- Feb 16, 2019 Hacking Java Applications with Byte Buddy and Decompilers
- Jan 5, 2019 Page Specific Dynamic Angular Components using Child Routes
- Oct 13, 2018 Understanding Dagger 2 Scopes Under The Hood
- Jul 21, 2018 Understanding and using Xdebug with PHPStorm and Magento remotely
Popular posts
- 140860 Views How to Install The Latest Apache Server (httpd) on Centos 7
- 102631 Views Routing network traffic through a transparent SOCKS5 proxy using DD-WRT
- 74277 Views How to Unbrick TP-Link WiFi Router WR841ND using TFTP and Wireshark
- 73218 Views Android Reverse Engineering: Debugging Smali in Smalidea
- 61452 Views Clean Architecture : Part 2 – The Clean Architecture